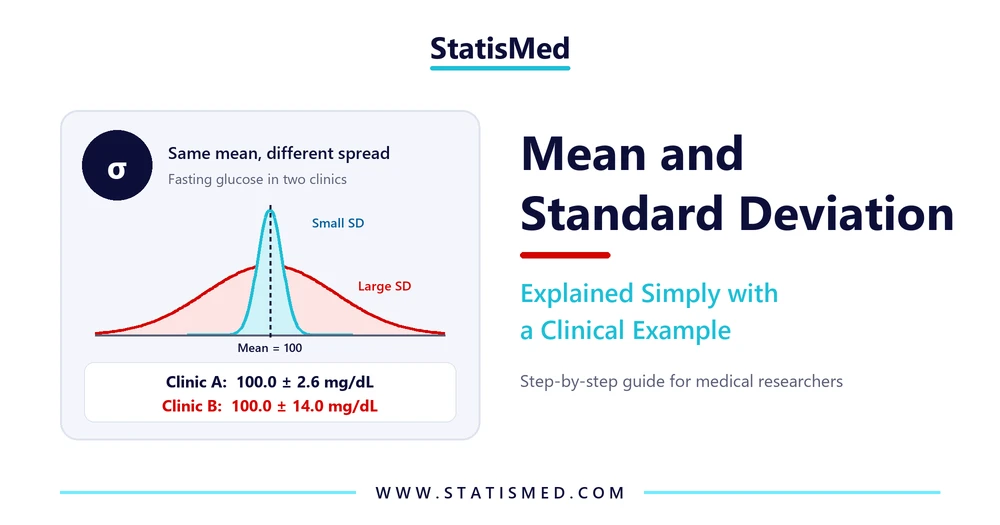
The mean and standard deviation are the two most frequently reported statistics in medical research. Almost every Table 1 in a published article describes patients using the mean and standard deviation of variables such as age, blood pressure, or laboratory values. Despite this, many junior researchers find it difficult to explain what the standard deviation means or when to report it. This guide explains mean and standard deviation in simple terms, shows how to calculate them with a clinical example, explains what a high standard deviation means, and shows how to interpret and report them correctly in your research.
Table of Contents
What Is the Mean?
The mean (or arithmetic average) is the sum of all values divided by the number of values. It describes the center of the data.
Mean = Σx ÷ n
For example, if five patients have fasting glucose values of 90, 95, 100, 105, and 110 mg/dL, the mean equals (90 + 95 + 100 + 105 + 110) ÷ 5 = 100 mg/dL. The mean is sensitive to extreme values; for this reason, it is most useful when the data are approximately normally distributed.
What Is Standard Deviation?
The standard deviation (SD) measures how spread out the values are around the mean. A small standard deviation indicates that most values are close to the mean, whereas a large standard deviation indicates that the values are widely scattered.
SD = √[ Σ(x − mean)² ÷ (n − 1) ]
In simple words, the standard deviation is the typical distance between each observation and the mean. It is expressed in the same unit as the original data, such as mg/dL or mmHg.
How to Calculate Mean and Standard Deviation: A Clinical Example
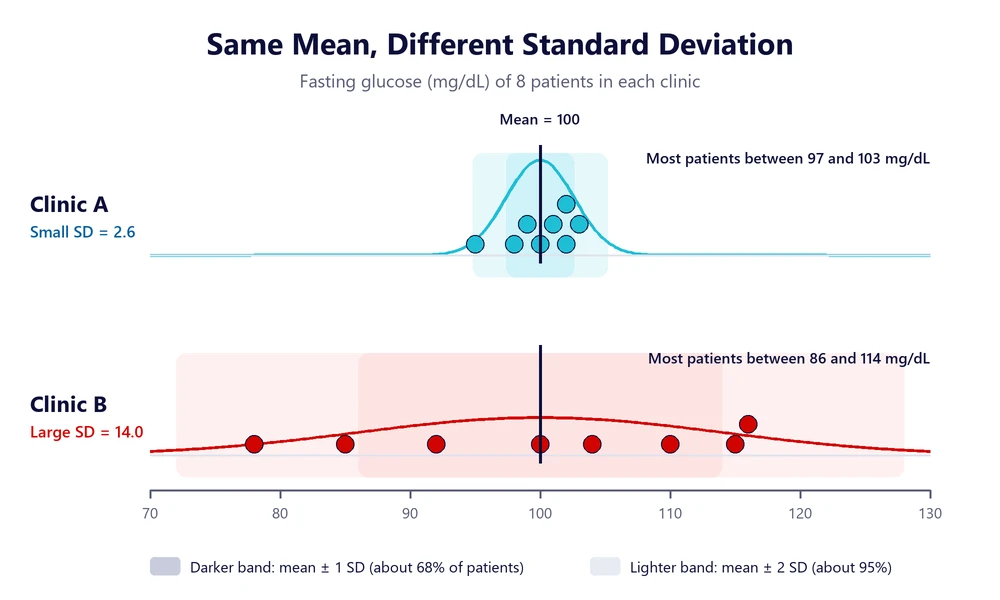
Consider a hypothetical example in which fasting glucose (mg/dL) was measured in eight patients at each of two clinics:
| Clinic | Fasting glucose values (mg/dL) | Mean | SD |
|---|---|---|---|
| Clinic A | 95, 98, 100, 101, 99, 102, 103, 102 | 100.0 | 2.6 |
| Clinic B | 78, 85, 92, 100, 104, 110, 116, 115 | 100.0 | 14.0 |
Step 1: Calculate the Mean
In both clinics, the sum of the eight values equals 800; therefore, the mean is 800 ÷ 8 = 100.0 mg/dL.
Step 2: Calculate the Deviations from the Mean
Subtract the mean from each value. In clinic A, the deviations range from −5 to +3, while in clinic B they range from −22 to +16.
Step 3: Square, Sum, and Divide by n − 1
Square each deviation, add them together, and divide by n − 1 (8 − 1 = 7). This value is the variance.
Step 4: Take the Square Root
The square root of the variance gives the standard deviation: 2.6 mg/dL in clinic A and 14.0 mg/dL in clinic B.
Notably, both clinics have exactly the same mean, but the patients in clinic B are much more variable. This is why the mean should never be reported without a measure of spread.
What Does a High Standard Deviation Mean?
A high standard deviation means that the values are widely spread around the mean, so the mean is a less precise description of a typical patient. In the example above, the high SD in clinic B indicates that some patients have low glucose values while others are close to the diabetic range, although the average is the same as in clinic A. In clinical research, a high standard deviation may reflect a heterogeneous population, real differences between patients, measurement errors, or the presence of outliers. On the other hand, a low standard deviation indicates that the values are consistent and clustered close to the mean.
Whether an SD is “high” depends on the size of the mean. The coefficient of variation (CV = SD ÷ mean × 100) allows comparison of variability across variables. In our example, the CV was 2.6% in clinic A and 14.0% in clinic B.
How to Interpret Mean and Standard Deviation in Research
The 68–95–99.7 Rule
When the data are approximately normally distributed, about 68% of the values fall within 1 SD of the mean, about 95% fall within 2 SD, and about 99.7% fall within 3 SD. For clinic B, about 95% of patients are expected to have glucose values between 72.0 and 128.0 mg/dL (100 ± 2 × 14.0).
Mean ± SD or Median (IQR)?
The mean and standard deviation are appropriate for symmetric, approximately normal data. When the data are skewed, such as hospital length of stay or inflammatory markers, the median and interquartile range (IQR) describe the data better. A useful warning sign is a standard deviation that is larger than half of the mean for a variable that cannot be negative. In this case, non-parametric tests, such as the Mann-Whitney U test, are usually preferred for group comparisons.
Standard Deviation vs Standard Error of the Mean
The standard deviation and the standard error of the mean (SEM) are frequently confused, although they answer different questions (Lee et al., 2015):
| Feature | Standard deviation (SD) | Standard error of the mean (SEM) |
|---|---|---|
| What it describes | Variability of individual values | Precision of the sample mean |
| Formula | √[Σ(x − mean)² ÷ (n − 1)] | SD ÷ √n |
| Effect of a larger sample | Stays about the same | Becomes smaller |
| Use in a paper | Describing participants (Table 1) | Calculating confidence intervals |
| Clinic B example | 14.0 mg/dL | 4.9 mg/dL |
Reporting the SEM instead of the SD to describe patients makes the data look less variable than they really are, which is a common error criticized by reviewers.
How to Report Mean and Standard Deviation in a Manuscript
Report the mean and SD with the same number of decimal places, together with the unit, for example “100.0 ± 14.0 mg/dL” or “mean = 100.0 mg/dL, SD = 14.0”. Avoid writing “±” without stating that it refers to the SD. An example of a Results paragraph is shown below:
Fasting Glucose by Clinic
The mean fasting glucose was 100.0 mg/dL (SD = 2.6) among patients of clinic A and 100.0 mg/dL (SD = 14.0) among patients of clinic B. (Table 1)
Common Mistakes When Using Mean and Standard Deviation
- Reporting the mean of skewed data: use the median and IQR when the distribution is clearly skewed.
- Confusing SD with SEM: use SD to describe participants and SEM or confidence intervals to describe the precision of the mean.
- Omitting the measure of spread: a mean alone hides the variability of the data.
- Reporting too many decimal places: use a precision that matches the measurement, usually one decimal place.
- Using the mean for ordinal scales: for Likert items, the median or percentages are usually more appropriate.
Importance of Mean and Standard Deviation in Medicine
The mean and standard deviation are used to describe study populations, to define reference ranges for laboratory tests, to calculate sample size, and to compare treatment groups using tests such as the t-test and analysis of variance. In addition, the standard deviation is required to calculate standardized effect sizes, such as Cohen’s d, and to plan the sample size of a study.
Conclusion
The mean describes the center of the data, and the standard deviation describes how much individual values vary around it. Both should be reported together, with units, for approximately normal data, while the median and IQR are preferred for skewed data. Furthermore, the standard deviation should not be confused with the standard error of the mean. If you need help describing, analyzing, or reporting your research data, the StatisMed team of biostatisticians can support you. You can request a free quote today.
Frequently Asked Questions
1. What is a good standard deviation?
There is no universally good value. The standard deviation should be judged relative to the mean and to the clinical context. The coefficient of variation helps compare variability between variables with different units or scales.
2. What does mean ± SD mean in research papers?
It summarizes a variable by its average value and its spread. For example, an age of 45.2 ± 8.1 years means that the average age was 45.2 years and that the ages of most participants were within about 8 years of this average.
3. When should I use the median instead of the mean?
Use the median and interquartile range when the data are skewed, contain extreme outliers, or are measured on an ordinal scale.
References
Lee, D. K., In, J., & Lee, S. (2015). Standard deviation and standard error of the mean. Korean Journal of Anesthesiology, 68(3), 220–223. https://doi.org/10.4097/kjae.2015.68.3.220