A meta-analysis is a statistical method that combines the results of several independent studies that examined the same question. It produces one pooled estimate that is more precise than any single study, and it sits at the top of the evidence hierarchy. However, many junior researchers treat the meta-analysis as a simple average of study results, or they ignore heterogeneity between studies. This guide explains each step in simple language, using one hypothetical clinical example from the research question to the forest plot and the Results paragraph.
Table of Contents
What Is a Meta-Analysis?
A meta-analysis is the quantitative part of a systematic review. The review identifies and appraises all relevant studies with a pre-specified protocol. Then, the meta-analysis calculates an effect size for each study and combines these effect sizes into a weighted average, where larger and more precise studies receive more weight. The result is usually displayed in a forest plot. A systematic review and meta analysis together show what the total evidence says and how consistent it is.
Fixed-Effect Meta-Analysis
The fixed-effect model assumes that all included studies estimate one true effect, and that differences between study results are caused only by sampling error. Each study is weighted by the inverse of its variance. It suits studies that are very similar in patients, interventions, and outcomes.
Random-Effects Meta-Analysis
The random-effects model assumes that the true effect differs from one study to another, for example because of differences in patient populations or treatment protocols. Therefore, it adds the between-study variance (τ²) to each study’s variance, which balances the weights and widens the confidence interval. The DerSimonian and Laird method is the most widely used approach to estimate τ².
Importance of Meta-Analysis in Medical Research
Increasing Statistical Power and Precision
Many trials are too small to detect a moderate effect. Combining their participants increases power and narrows the confidence interval of the effect estimate. In the example below, five of the six trials were not significant alone, but the pooled analysis was.
Resolving Conflicting Results
When some studies report a benefit and others report none, meta-analysis gives a transparent summary and examines whether the conflict reflects true differences or chance.
Supporting Clinical Guidelines and Decisions
Guideline panels depend on pooled estimates. Moreover, a meta-analysis identifies evidence gaps and helps researchers plan future trials and their sample size. You can read more about this role in our article on biostatistics in evidence-based medicine.
Applications of Meta-Analysis in Clinical Studies
Randomized Clinical Trials
The most common application is pooling trials that compared the same intervention with a control, for binary outcomes (mortality, infection) or continuous outcomes (blood pressure, pain score).
Observational and Epidemiological Studies
Adjusted odds ratios or hazard ratios from cohort and case-control studies are pooled to estimate exposure–disease associations, such as smoking and stroke. Confounding must be discussed carefully.
Prevalence and Diagnostic Studies
Researchers also pool prevalence estimates to describe disease burden, or sensitivity and specificity to evaluate a diagnostic test.
Assumptions of Meta-Analysis
Before pooling, check the following:
- Systematic and complete search: studies are identified with a pre-specified, reproducible search strategy, reported according to the PRISMA 2020 statement (Page et al., 2021).
- Clinical similarity: the studies have comparable populations, interventions, comparators, and outcomes (PICO).
- Same effect measure: every study provides the same effect size, such as the risk ratio, odds ratio, or mean difference, with its standard error or confidence interval.
- Independent estimates: each participant contributes to only one estimate.
- Assessed study quality: the risk of bias of each study is evaluated, because pooling biased studies produces a precise but biased result.
How to Perform a Meta-Analysis: A Clinical Example
Consider a hypothetical systematic review that asked the following question: in adults undergoing abdominal surgery, does an antimicrobial wound dressing reduce surgical site infection (SSI) compared with a standard dressing? The review identified six randomized trials with a total of 1,800 patients. All data below are hypothetical and are used only for teaching.
Step 1: Define the Question and Register the Protocol
The question is written in PICO format: P = adults undergoing abdominal surgery, I = antimicrobial dressing, C = standard dressing, O = SSI within 30 days. The protocol, including the search strategy and planned methods, is registered in advance, for example in PROSPERO, to prevent selective reporting.
Step 2: Extract the Data from Each Study
Two reviewers independently extract the events and patients in each arm (Table 1).
| Study | Antimicrobial: SSI / n (%) | Standard: SSI / n (%) |
|---|---|---|
| Study A, 2016 | 7 / 100 (7.0%) | 16 / 100 (16.0%) |
| Study B, 2017 | 12 / 150 (8.0%) | 20 / 150 (13.3%) |
| Study C, 2019 | 5 / 80 (6.3%) | 11 / 80 (13.8%) |
| Study D, 2020 | 21 / 200 (10.5%) | 22 / 200 (11.0%) |
| Study E, 2022 | 6 / 120 (5.0%) | 24 / 120 (20.0%) |
| Study F, 2023 | 15 / 250 (6.0%) | 19 / 250 (7.6%) |
| Total | 66 / 900 (7.3%) | 112 / 900 (12.4%) |
Step 3: Calculate the Effect Size for Each Study
The effect size calculation is performed for each trial. For a binary outcome, the risk ratio (RR) is common, and the analysis uses its natural logarithm (ln RR) because ratios are not symmetric. For Study A, RR = (7 ÷ 100) ÷ (16 ÷ 100) = 0.44, and ln RR = −0.827. The standard error is calculated as follows:
SE (ln RR) = √(1/a − 1/n₁ + 1/c − 1/n₂)
where a and c are the events and n₁ and n₂ are the group sizes. For Study A, SE = √(1/7 − 1/100 + 1/16 − 1/100) = 0.431. The results of all studies are shown in Table 2. Notably, only Study E shows a significant reduction alone, because its confidence interval does not include 1. For more details on this concept, see our guide on effect size in statistical analysis.
| Study | RR (95% CI) | ln RR | SE | Weight, fixed (%) | Weight, random (%) |
|---|---|---|---|---|---|
| Study A | 0.44 (0.19 to 1.02) | −0.827 | 0.431 | 12.3 | 14.2 |
| Study B | 0.60 (0.30 to 1.18) | −0.511 | 0.346 | 19.1 | 18.7 |
| Study C | 0.45 (0.17 to 1.25) | −0.788 | 0.516 | 8.6 | 11.0 |
| Study D | 0.95 (0.54 to 1.68) | −0.047 | 0.288 | 27.5 | 22.7 |
| Study E | 0.25 (0.11 to 0.59) | −1.386 | 0.438 | 11.9 | 13.9 |
| Study F | 0.79 (0.41 to 1.52) | −0.236 | 0.334 | 20.5 | 19.5 |
Step 4: Assign the Weights
In the fixed-effect model, the weight of each study equals 1 ÷ SE². Therefore, Study D, which has the smallest standard error, receives the largest weight (27.5%), while the small Study C receives only 8.6%. In the random-effects model, the weight equals 1 ÷ (SE² + τ²). Adding τ² reduces the dominance of large studies: Study D falls to 22.7%, and Study C rises to 11.0% (Table 2).
Step 5: Calculate the Pooled Effect and Draw the Forest Plot
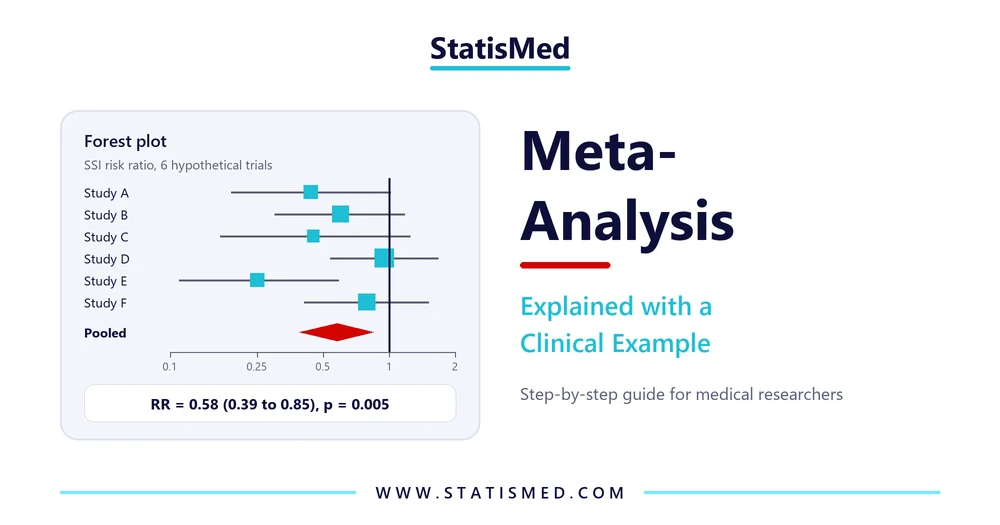
The pooled ln RR is the weighted average of the study ln RRs, and it is transformed back to the RR scale. The fixed-effect model gives a pooled RR = 0.61, 95% CI, 0.45 to 0.82, p = 0.001. The random-effects model gives a pooled RR = 0.58, 95% CI, 0.39 to 0.85, p = 0.005. Both models show a significant reduction in SSI. However, a significant p-value alone does not show clinical importance; the size of the effect and its interval matter more.
The forest plot shows each study as a square sized by its weight, with a horizontal line for its 95% CI. The pooled effect is a diamond, and a vertical line marks RR = 1 (no effect). In our example, all six squares lie on the left side, which favors the antimicrobial dressing, and the diamond does not cross the line.
Step 6: Assess Heterogeneity
Heterogeneity is the variation between study results beyond chance. First, Cochran’s Q test gives Q = 8.09, df = 5, p = 0.152. Second, the I² statistic describes the percentage of total variation caused by true differences between studies, rather than by chance (Higgins et al., 2003). In this example, I² = 38.2%, which indicates low to moderate heterogeneity. Third, τ² = 0.087 is the estimated between-study variance on the ln RR scale.
The Q test has low power with few studies; therefore, a non-significant Q does not prove homogeneity. In addition, the 95% prediction interval, which shows the expected effect of a future similar trial, ranges from 0.22 to 1.55.
Step 7: Perform Sensitivity Analysis and Assess Publication Bias
A leave-one-out sensitivity analysis repeats the random-effects meta-analysis six times, removing one study each time. In our example, the pooled RR ranged from 0.51 (without Study D) to 0.69 (without Study E), and it remained significant in all six analyses (all p ≤ 0.023). Notably, removing Study E reduced I² from 38.2% to 0%, which identifies this trial as the main source of heterogeneity.
Publication bias is usually examined with a funnel plot and Egger’s test. However, these methods are unreliable with fewer than 10 studies, so with six trials the review should state that publication bias could not be assessed formally.
How to Report Meta-Analysis Results in a Manuscript
The Results should state the number of studies and patients, the pooled effect with its 95% CI and p-value, and the sensitivity analysis, while Q, I², and τ² appear in the forest plot. An example is shown below:
Effect of Antimicrobial Dressing on Surgical Site Infection
Six randomized trials including 1,800 patients were included in the meta-analysis. Surgical site infection occurred in 7.3% of patients who received the antimicrobial dressing compared to 12.4% of patients who received the standard dressing. The antimicrobial dressing was associated with a significantly lower risk of surgical site infection (RR = 0.58, 95% CI, 0.39 to 0.85, p = 0.005). Moreover, the reduction remained significant in the leave-one-out sensitivity analysis, with pooled risk ratios ranging from 0.51 to 0.69 (all p < 0.05). (Figure 1)
Notably, the explanation of the findings, the comparison with previous reviews, and the clinical implications belong to the Discussion section, not to the Results.
Common Mistakes When Conducting a Meta-Analysis
Pooling Studies That Are Too Different
Combining trials with different populations, doses, or outcome definitions produces an average that applies to no real patient. Subgroup analyses should be planned in the protocol.
Choosing the Model Based on the I² Value
Many researchers select the model after seeing I². However, the model should be chosen in advance; in most clinical reviews, the random-effects model is the realistic choice.
Ignoring the Risk of Bias
A meta-analysis cannot correct the bias of the original studies. Therefore, each trial should be assessed, for example with the Cochrane RoB 2 tool.
Mixing Effect Measures
Odds ratios, risk ratios, and hazard ratios should not be pooled together. Instead, the same effect size should be calculated for every study from the raw data. You can review the meaning of the odds ratio in our guide on logistic regression.
Running a Meta-Analysis in SPSS and R
In SPSS version 28 and later, a meta-analysis of binary outcomes is performed through Analyze → Meta Analysis → Binary Outcomes → Raw Data. Enter the event and total counts, select “Risk Ratio” and the random-effects model, and request the forest plot.
In R, the metafor package performs the same analysis with one line of code: rma(measure = "RR", ai = e1, n1i = n1, ci = e2, n2i = n2, data = dat, method = "DL"), followed by forest(). The argument method = “DL” reproduces this example; the default (REML) may give slightly different values. If you are new to R, start with our beginner’s guide to statistical analysis with R. For single trials, see our guides on the chi-square test and on choosing the right statistical test.
Conclusion
Meta-analysis combines the results of several studies into one precise estimate, and it is the statistical core of every systematic review. A correct analysis starts with a registered protocol, uses the same effect size for every study, weights studies by precision, and examines heterogeneity and sensitivity. Furthermore, a complete report includes the pooled effect with its 95% CI, the heterogeneity statistics, and a forest plot. If you need support in planning your review, running the meta-analysis, or writing the Results, the StatisMed team of biostatisticians provides statistical analysis services for medical studies. You can request a free quote today.
Frequently Asked Questions
1. What is the difference between a systematic review and a meta-analysis?
A systematic review is the complete process of searching, selecting, and appraising studies with a pre-specified protocol. A meta-analysis is the statistical pooling of the results of these studies.
2. How many studies are needed for a meta-analysis?
Two studies are enough technically. However, τ² is unreliable with few studies, and funnel plots require at least 10 studies.
3. What does an I² value of 75% mean?
An I² of 75% means that about three quarters of the variation in study results reflects true differences between studies rather than chance. This is high heterogeneity, and its sources should be explored with subgroup analysis or meta-regression.
References
Higgins, J. P. T., Thompson, S. G., Deeks, J. J., & Altman, D. G. (2003). Measuring inconsistency in meta-analyses. BMJ, 327(7414), 557–560. https://doi.org/10.1136/bmj.327.7414.557
Page, M. J., McKenzie, J. E., Bossuyt, P. M., Boutron, I., Hoffmann, T. C., Mulrow, C. D., … Moher, D. (2021). The PRISMA 2020 statement: An updated guideline for reporting systematic reviews. BMJ, 372, n71. https://doi.org/10.1136/bmj.n71