
The chi-square test is one of the most frequently used statistical tests in medical research. It is applied whenever researchers need to compare proportions between groups, such as the percentage of patients who developed a complication, responded to a treatment, or carried a risk factor. Despite its popularity, many junior researchers apply the chi-square test without checking its assumptions or report its results incompletely. This guide explains the chi square test in simple steps, using one clinical example from the beginning to the end, so that you can perform, interpret, and report it correctly in your own study.
Table of Contents
What Is the Chi-Square Test?
The chi-square (χ²) test is a non-parametric test used for categorical variables, which are variables measured as counts in categories (for example, infected/not infected, smoker/non-smoker, or mild/moderate/severe). The test compares the frequencies observed in the study with the frequencies that would be expected if there were no relationship between the variables. When the difference between observed and expected frequencies is large, the chi-square value increases and the p-value decreases (McHugh, 2013).
Chi-Square Test of Independence
This is the most common form in clinical studies. It examines whether two categorical variables are associated, such as the type of surgical dressing and the occurrence of wound infection. The data are arranged in a contingency table, where rows represent one variable and columns represent the other.
Chi-Square Goodness-of-Fit Test
The goodness of fit test examines whether the distribution of one categorical variable matches an expected distribution. For example, a researcher may test whether the distribution of blood groups in a hospital sample matches the known national distribution.
Chi-Square Test of Homogeneity
The test of homogeneity uses the same calculation as the test of independence. However, it is applied when samples are drawn separately from different populations, and the aim is to examine whether the distribution of a categorical outcome is similar across these populations.
Importance of the Chi-Square Test in Medical Research
Comparing Proportions Between Patient Groups
Most clinical outcomes are reported as proportions, such as mortality, complication rates, or the percentage of patients achieving remission. The chi-square test provides a direct and simple method to examine whether these proportions differ significantly between two or more groups.
Identifying Risk Factors
In cross-sectional and case-control studies, the chi-square test is commonly the first step in identifying factors associated with a disease. Variables that show a significant association are then entered into multivariable models, such as logistic regression, to adjust for confounding.
Simple Calculation and Wide Acceptance
The chi-square test does not require normally distributed data, and it can be calculated from a simple table of counts. Moreover, it is accepted by all medical journals and is available in every statistical software package, including SPSS, R, Stata, and Excel.
Applications of the Chi-Square Test in Clinical Studies
Randomized Clinical Trials
In clinical trials, the chi-square test is used to compare binary outcomes between the intervention and control arms, such as infection, readmission, or treatment success. It is also used in the baseline table to examine whether categorical characteristics, such as gender and smoking status, are balanced between the study groups.
Epidemiological and Cross-Sectional Studies
Epidemiologists use the chi-square test to examine the association between exposures and diseases, for example, the association between obesity categories and hypertension, or between vaccination status and hospitalization.
Questionnaire and Survey Studies
In knowledge, attitude, and practice (KAP) surveys, the chi-square test is applied to compare response categories between groups, such as the level of knowledge among physicians versus nurses or among different age groups.
Assumptions of the Chi-Square Test
Before applying the test, the following assumptions must be checked:
- Categorical variables: both variables are measured as categories, not as continuous values.
- Independent observations: each participant contributes to only one cell of the table. Paired or repeated measurements on the same patients are not suitable for the chi-square test.
- Frequencies, not percentages: the test is calculated from the actual counts of participants.
- Adequate expected counts: the expected frequency should be 5 or more in at least 80% of the cells, and no cell should have an expected frequency below 1. In a 2×2 table, all expected counts should be 5 or more.
How to Perform the Chi-Square Test: A Clinical Example
Consider a hypothetical randomized trial that included 240 patients undergoing abdominal surgery. Patients were randomly assigned to a new antimicrobial wound dressing (n = 120) or to the standard dressing (n = 120). The outcome was surgical site infection (SSI) within 30 days after surgery. The research question was: is the type of dressing associated with the occurrence of SSI?
Step 1: State the Hypotheses
The null hypothesis (H₀) states that there is no association between the type of dressing and SSI, meaning that the infection rate is the same in both groups. On the other hand, the alternative hypothesis (H₁) states that the type of dressing and SSI are associated. The significance level is set at α = 0.05. For more details about this step, you can read our guide on sample size in research, since the hypotheses and the sample size are planned together.
Step 2: Build the Contingency Table (Observed Frequencies)
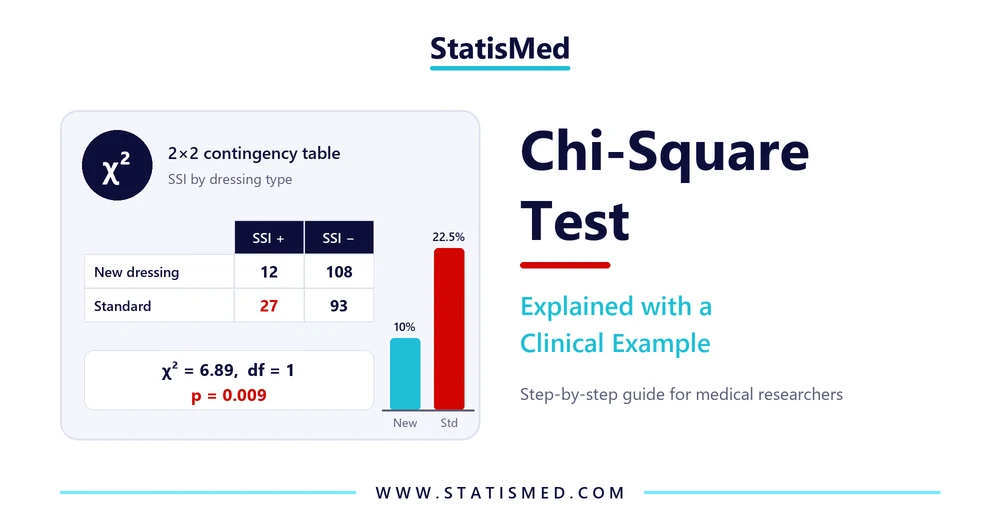
At the end of follow-up, 12 patients in the new dressing group and 27 patients in the standard dressing group developed SSI. The observed frequencies are organized in a 2×2 contingency table:
| Dressing type | SSI: Yes | SSI: No | Total |
|---|---|---|---|
| New antimicrobial dressing | 12 (10.0%) | 108 (90.0%) | 120 |
| Standard dressing | 27 (22.5%) | 93 (77.5%) | 120 |
| Total | 39 | 201 | 240 |
Step 3: Calculate the Expected Frequencies
The expected frequency of each cell is the frequency that would be observed if the null hypothesis were true. It is calculated as follows:
Expected frequency = (Row total × Column total) ÷ Grand total
For the cell “new dressing with SSI”, the expected frequency equals (120 × 39) ÷ 240 = 19.5. Similarly, the expected frequency for “new dressing without SSI” equals (120 × 201) ÷ 240 = 100.5. Since both groups have equal sizes, the standard dressing row has the same expected values (19.5 and 100.5). All expected frequencies are above 5; therefore, the chi-square test is appropriate.
Step 4: Apply the Chi-Square Formula
The chi square formula sums the squared differences between observed (O) and expected (E) frequencies, divided by the expected frequency, across all cells:
χ² = Σ (O − E)² ÷ E
For the four cells of our table:
| Cell | O | E | (O − E)² ÷ E |
|---|---|---|---|
| New dressing, SSI | 12 | 19.5 | 2.885 |
| New dressing, no SSI | 108 | 100.5 | 0.560 |
| Standard dressing, SSI | 27 | 19.5 | 2.885 |
| Standard dressing, no SSI | 93 | 100.5 | 0.560 |
| Total (χ²) | 6.89 |
Step 5: Determine the Degrees of Freedom and the P-Value
The degrees of freedom (df) are calculated as (number of rows − 1) × (number of columns − 1). In a 2×2 table, df = (2 − 1) × (2 − 1) = 1. Using the chi square table, the critical value at df = 1 and α = 0.05 is 3.841. Since the calculated value (6.89) is larger than 3.841, the null hypothesis is rejected. Statistical software gives the exact p-value, which is p = 0.009. In addition, many programs report the continuity-corrected (Yates) chi-square for 2×2 tables, which equals 6.00 (p = 0.014) in this example and leads to the same conclusion.
Step 6: Measure the Strength of the Association
A significant p-value shows that an association exists, but it does not show how strong or clinically important it is. Therefore, an effect size should always accompany the chi-square test. For a 2×2 table, the phi coefficient (φ) equals √(χ² ÷ n) = √(6.89 ÷ 240) = 0.17, which indicates a small association.
For larger tables, Cramér’s V is used instead. In clinical studies, it is also recommended to report the risk ratio (RR) or odds ratio (OR) with its 95% confidence interval. In this example, the risk of SSI with the new dressing was less than half the risk with the standard dressing (RR = 0.44, 95% CI, 0.24 to 0.84). You can read more about this topic in our article on effect size in statistical analysis.
How to Report Chi-Square Results in a Manuscript
The Results section should present the percentages in each group, the chi-square value, the degrees of freedom, the p-value, and the effect estimate, without interpretation. An example of a correctly written Results paragraph is shown below:
Surgical Site Infection According to Dressing Type
Surgical site infection occurred in 39 patients (16.3%). The infection rate was significantly lower among patients who received the antimicrobial dressing (10.0%) compared to those who received the standard dressing (22.5%) (χ² = 6.89, df = 1, p = 0.009). Moreover, the antimicrobial dressing was associated with lower odds of infection (OR = 0.38, 95% CI, 0.18 to 0.80, p = 0.010). (Table 2)
Notably, the explanation of why the new dressing reduced infection, and the comparison with previous studies, belong to the Discussion section, not to the Results.
Common Mistakes When Using the Chi-Square Test
Ignoring Small Expected Frequencies
When more than 20% of cells have expected frequencies below 5, the chi-square approximation becomes inaccurate. In this case, Fisher’s exact test should be used, especially in 2×2 tables with small samples (Kim, 2017). Alternatively, related categories can be merged when this is clinically meaningful.
Applying the Test to Paired Data
The chi-square test assumes independent observations. When the same patients are measured twice, such as before and after an intervention, McNemar’s test should be used instead.
Using Percentages Instead of Counts
Entering percentages instead of actual counts into the calculation produces incorrect chi-square values. The test must always be calculated from the number of participants in each cell.
Confusing Statistical Significance with Clinical Importance
In very large samples, small and clinically unimportant differences can become statistically significant. For this reason, effect sizes and confidence intervals should be reported together with the p-value.
Ignoring Ordered Categories
When one variable is ordinal, such as disease stage I to IV, the standard chi-square test ignores the order of categories. In this case, the chi-square test for trend (linear-by-linear association) provides a more appropriate analysis.
Running the Chi-Square Test in SPSS and R
In SPSS, the test is performed through Analyze → Descriptive Statistics → Crosstabs. Place the exposure variable in “Row(s)” and the outcome in “Column(s)”, then select “Chi-square” and “Phi and Cramér’s V” under Statistics, and select “Expected” and “Row percentages” under Cells. SPSS reports Pearson chi-square, the continuity correction, and Fisher’s exact test in the same output table.
In R, the same analysis is performed with one line of code: chisq.test(table(data$dressing, data$ssi), correct = FALSE).
For non-categorical outcomes, other tests are needed, such as the Mann-Whitney U test for skewed continuous data or the Kruskal-Wallis test for more than two groups.
Conclusion
The chi-square test is a simple and powerful tool for examining the association between categorical variables in medical research. Correct use requires independent observations, adequate expected frequencies, and calculation from actual counts. Furthermore, a complete report includes the percentages in each group, the chi-square value, the degrees of freedom, the p-value, and an effect estimate with its 95% confidence interval. If you need support in selecting the appropriate test, analyzing your data, or writing the Results section of your manuscript, the StatisMed team of biostatisticians provides statistical analysis services for medical studies. You can request a free quote today.
Frequently Asked Questions
1. When should I use Fisher’s exact test instead of the chi-square test?
Fisher’s exact test should be used when the expected frequency is below 5 in any cell of a 2×2 table, or in more than 20% of the cells of a larger table. It is common in small pilot studies and in studies of rare outcomes.
2. Can the chi-square test be used with more than two groups?
Yes. The chi-square test can be applied to tables of any size, such as three treatment groups compared for three response categories (a 3×3 table, df = 4). When the overall test is significant, post-hoc comparisons using adjusted standardized residuals or pairwise tests with Bonferroni correction identify which groups differ.
3. Does a significant chi-square test prove that the exposure causes the outcome?
No. The chi-square test shows an association only. Causal conclusions depend on the study design, such as randomization in clinical trials, and on adjustment for confounding factors using multivariable methods.
References
Kim, H. Y. (2017). Statistical notes for clinical researchers: Chi-squared test and Fisher’s exact test. Restorative Dentistry & Endodontics, 42(2), 152–155. https://doi.org/10.5395/rde.2017.42.2.152
McHugh, M. L. (2013). The chi-square test of independence. Biochemia Medica, 23(2), 143–149. https://doi.org/10.11613/BM.2013.018