Understanding Mean, Median, and Mode: A Complete Guide
When it comes to statistical analysis, understanding the concepts of mean, median, and mode is essential. These measures of central tendency provide valuable insights into a dataset and help us make sense of the numbers. At StatisMed, we specialize in providing statistical analysis services for medical doctors, helping them interpret data accurately and make informed decisions. In this comprehensive guide, we will delve into the definitions of mean, median, and mode, their differences, and how they are calculated.
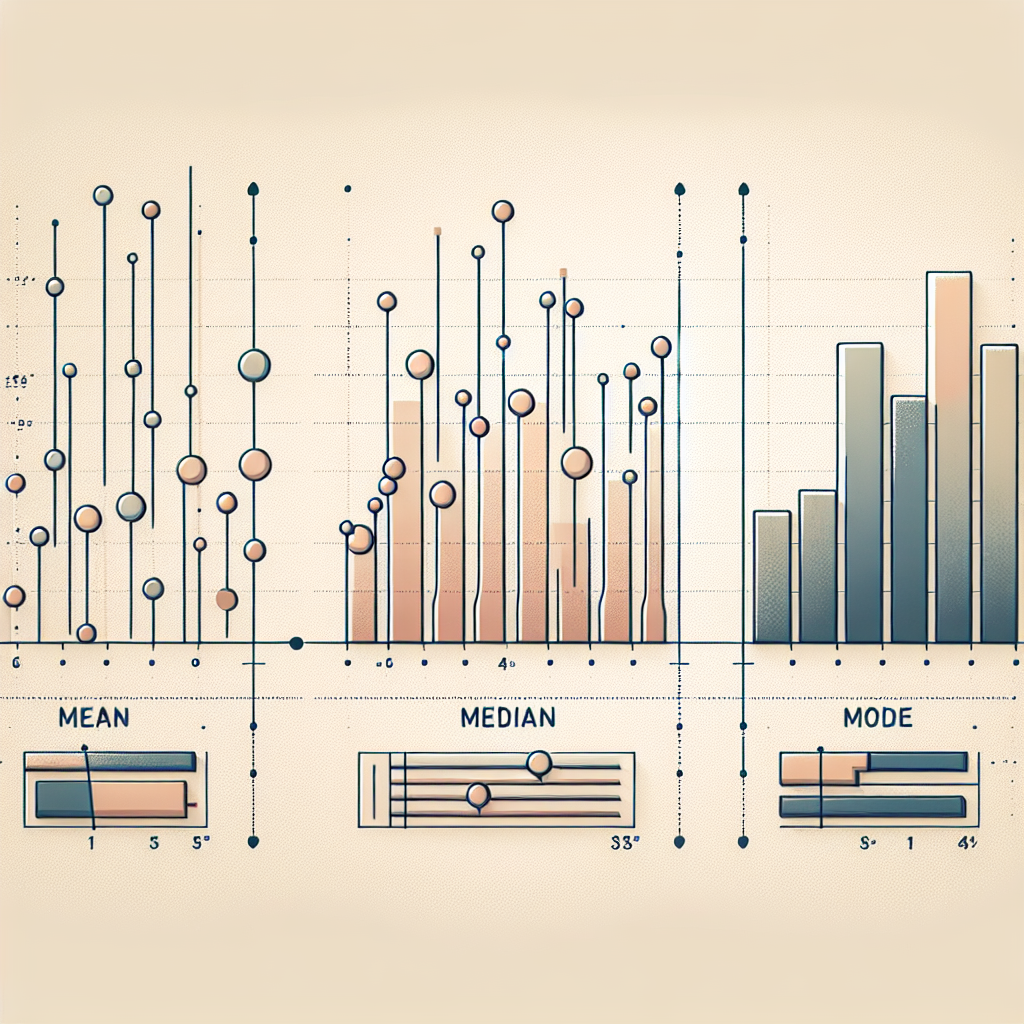
Mean
The mean, also known as the average, is calculated by summing up all the values in a dataset and dividing by the total number of values. It is denoted by the symbol “μ” and is a representative value that gives us an overall idea of the dataset. For example, if we have a dataset of patients’ ages – 30, 35, 40, and 45 – the mean age would be calculated as (30+35+40+45)/4 = 37.5. The mean is sensitive to outliers, meaning that a few extreme values can significantly impact the calculated average.
Median
The median is the middle value in a dataset when values are arranged in ascending order. If the dataset has an odd number of values, the median is the middle value itself. If the dataset has an even number of values, the median is the average of the two middle values. The median is denoted by the symbol “Mdn” and is less affected by outliers than the mean. For example, in the dataset of patients’ ages – 30, 35, 40, and 45 – the median age would be 37.5, as it is the average of the two middle values.
Mode
The mode is the value that appears most frequently in a dataset. Unlike the mean and median, the mode can be multiple values or even non-existent if all values are unique. The mode is denoted by the symbol “Mo” and is useful for identifying the most common value in a dataset. For example, in the dataset of patients’ ages – 30, 35, 40, and 45 – there is no mode as all values are unique. However, if we add another value, such as 30, the mode would be 30 as it appears twice, more than any other value.
In conclusion, mean, median, and mode are essential measures of central tendency that provide valuable insights into a dataset. Each measure has its own strengths and weaknesses, and understanding them is crucial for accurate data interpretation. At StatisMed, we specialize in providing statistical analysis services for medical doctors, helping them make informed decisions based on data-driven insights. If you require statistical analysis services, do not hesitate to contact us or request a quote.
[ad_2]