
[ad_1]
When it comes to statistical analysis, understanding the Normal Distribution Curve is essential for medical professionals to make informed decisions based on data. At StatisMed, we specialize in providing statistical analysis services for medical doctors, helping them interpret and utilize data effectively.
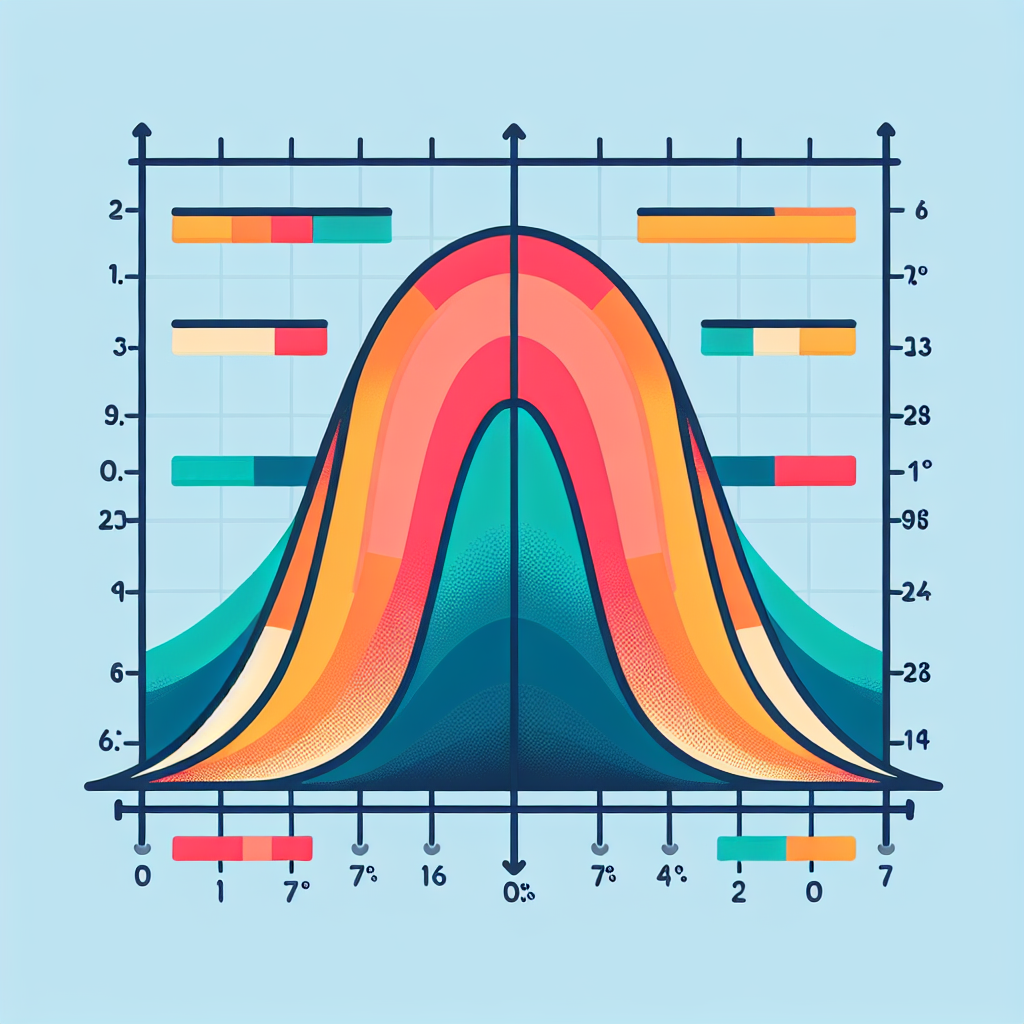
The normal distribution curve, also known as the bell curve, is a fundamental concept in statistics that describes the distribution of a set of data values. It is symmetrical, with the majority of values clustered around the mean, forming a bell-shaped curve. By understanding the normal distribution curve, medical professionals can better analyze patient data, make accurate diagnoses, and develop effective treatment plans.
Characteristics of the Normal Distribution Curve
-
- Symmetry: The normal distribution curve is symmetrical, with the mean, median, and mode all at the center of the distribution.
-
- Bell-shaped: The curve forms a bell shape, with the highest point at the mean and gradually tapering off on either side.
-
- Standard Deviation: The spread of data around the mean is measured by the standard deviation, which indicates how closely the data points cluster around the mean.
-
- 68-95-99.7 Rule: Approximately 68% of the data falls within one standard deviation, 95% within two standard deviations, and 99.7% within three standard deviations of the mean.
Understanding these characteristics can help medical professionals interpret data and make informed decisions based on the distribution of values. At StatisMed, our team of statisticians can assist in analyzing medical data to identify trends and patterns within the normal distribution curve.
Importance of the Normal Distribution Curve in Medicine
-
- Diagnosis: By understanding the normal distribution curve, doctors can interpret test results and diagnostic information more effectively.
-
- Treatment Planning: The normal distribution curve helps in determining treatment effectiveness and predicting patient outcomes based on statistical analysis.
-
- Clinical Research: Researchers use the normal distribution curve to analyze clinical trial data and draw conclusions about the effectiveness of treatments.
By utilizing statistical analysis services from StatisMed, medical professionals can harness the power of the normal distribution curve to improve patient care and outcomes.
Applications of the Normal Distribution Curve in Medical Research
-
- Epidemiology: Studying disease patterns and distribution within populations.
-
- Clinical Trials: Analyzing patient responses to treatments and medications.
-
- Public Health: Monitoring trends in health metrics and outcomes within communities.
By incorporating statistical analysis techniques that focus on the normal distribution curve, medical researchers can gain valuable insights into disease patterns, treatment efficacy, and overall public health outcomes.
In conclusion, understanding the normal distribution curve is crucial for medical professionals to make data-driven decisions and improve patient care. By partnering with StatisMed for statistical analysis services, medical doctors can leverage the power of the normal distribution curve to enhance diagnosis, treatment planning, and clinical research. Contact us today to learn more about how our team can assist you in leveraging statistical analysis for better patient outcomes.
[ad_2]


